Fig. 23
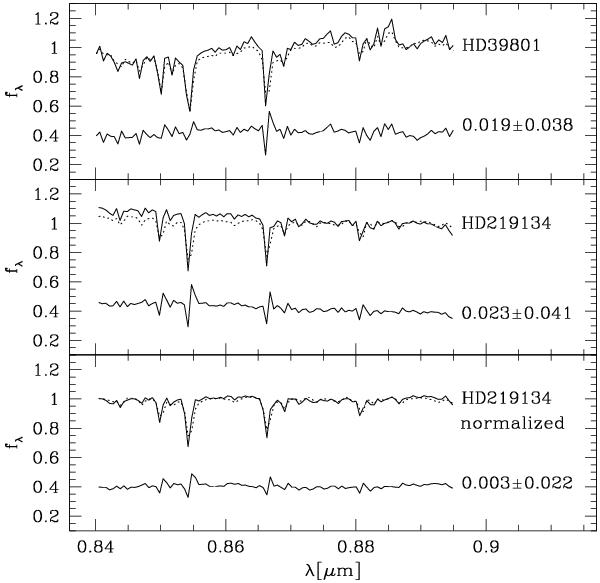
Direct comparison of the spectra of Betelgeuse (HD 39801, top panel) and HD 219134 (middle panel) from the libraries of Rayner et al. (2009, solid lines) and Cenarro et al. (2001a, 2002, dotted lines). In the bottom panel the continuum normalized spectra of HD 219134 are shown. In each panel the difference of the two corresponding spectra are plotted (shifted by +0.4 for displaying purposes) and the rms value is given.
Current usage metrics show cumulative count of Article Views (full-text article views including HTML views, PDF and ePub downloads, according to the available data) and Abstracts Views on Vision4Press platform.
Data correspond to usage on the plateform after 2015. The current usage metrics is available 48-96 hours after online publication and is updated daily on week days.
Initial download of the metrics may take a while.