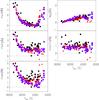
Fig. 11
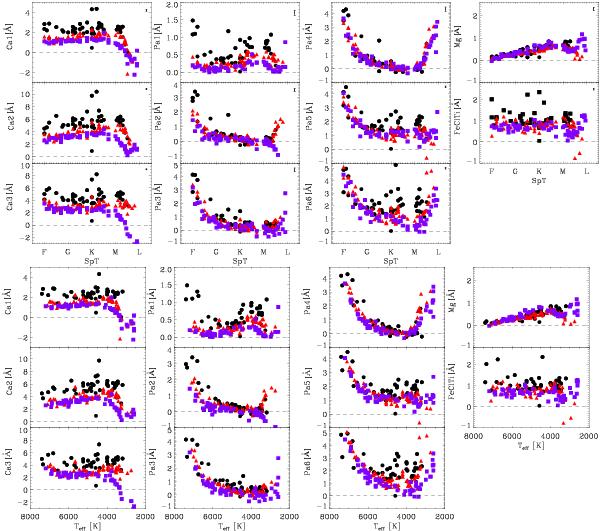
Equivalent width of the I-band indices as function of spectral type (top panels) and effective temperature (bottom panels). The different symbols correspond to the supergiant (circles), giant (triangles), and dwarf stars (squares), respectively. For each index on the right side of the plot the median of the errors is shown (top panels).
Current usage metrics show cumulative count of Article Views (full-text article views including HTML views, PDF and ePub downloads, according to the available data) and Abstracts Views on Vision4Press platform.
Data correspond to usage on the plateform after 2015. The current usage metrics is available 48-96 hours after online publication and is updated daily on week days.
Initial download of the metrics may take a while.