Free Access
Fig. 3
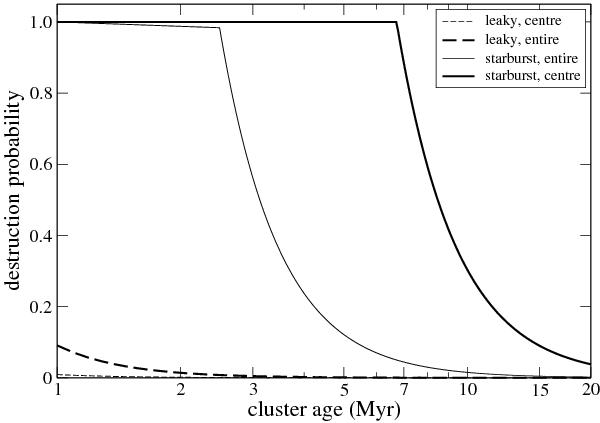
Probability for encounters closer than 100 AU taking place as function of cluster age. The solid and the dashed lines show the estimates for starburst and leaky clusters, respectively. The thick and thin lines distinguish between the entire cluster and the central area only.
Current usage metrics show cumulative count of Article Views (full-text article views including HTML views, PDF and ePub downloads, according to the available data) and Abstracts Views on Vision4Press platform.
Data correspond to usage on the plateform after 2015. The current usage metrics is available 48-96 hours after online publication and is updated daily on week days.
Initial download of the metrics may take a while.