Fig. 2
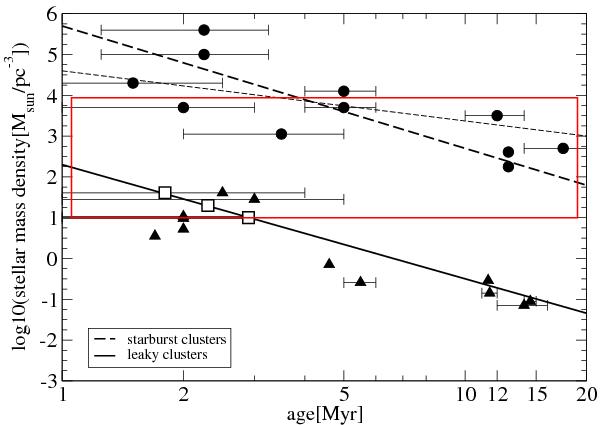
Mean cluster density as function of the cluster age for starburst (circles – observed values and dashed line – interpolation as in Pfalzner 2009) and leaky clusters (triangles and solid line, observations and interpolation, respectively). The red box shows the density requirement for solar-system-forming encounters to be likely. The open squares show the parameters of the clusters modelled in Sect. 4. The thin dashed line shows a fit through the data case where the Arches cluster is excluded from the starburst cluster sequence. Here only the errors in cluster age are given, the errors in cluster densities can be found in Fig. 2 of Pfalzner (2009).
Current usage metrics show cumulative count of Article Views (full-text article views including HTML views, PDF and ePub downloads, according to the available data) and Abstracts Views on Vision4Press platform.
Data correspond to usage on the plateform after 2015. The current usage metrics is available 48-96 hours after online publication and is updated daily on week days.
Initial download of the metrics may take a while.