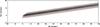
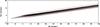
Fig. 7
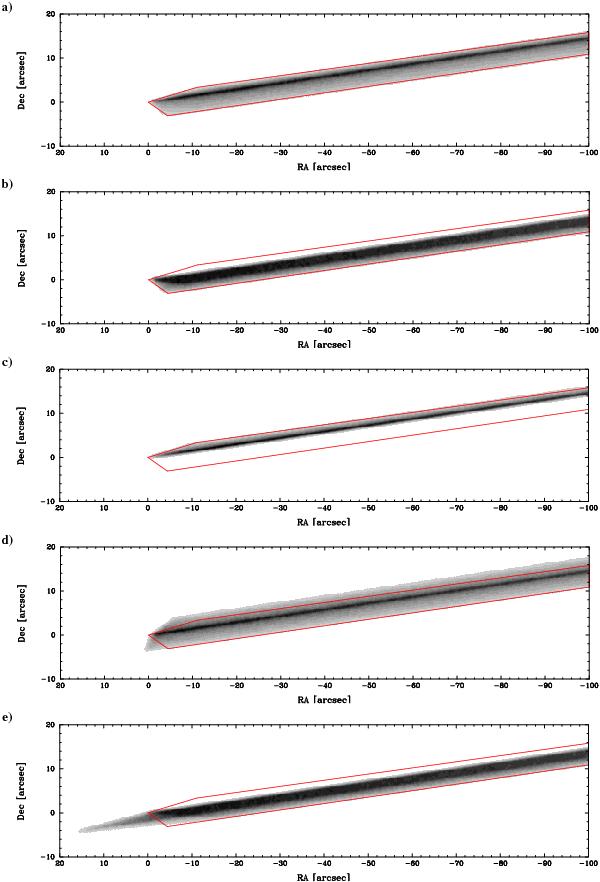
a) The best hollow cone model, filling the estimated P/2010 A2 dust envelope (red). This model consisted of a cone with an opening angle αc = 40°, pointing downward at φA2 = −20° and forward at θA2 = 74°, with a maximum dust velocity vdmax = 0.2 ms-1. The central streak is the zero-velocity component of the dust distribution. b) A hollow cone model with a thin cone αc = 10° and φA2 = −30°. Many thin cone models pointing downward successfully fill the bottom part of the envelope, but do not account for the top. c) A hollow cone model with a thin cone αc = 10° and φA2 = + 10°. Models with φA2 = >0° tend to fill or overfill the top part of the envelope, but leave the bottom part empty. d) A broad cone with αc = 80° and φA2 = −20° tends to overfill the envelope, producing a spur on the left, and fails to match the top contour of the envelope. e) A broad cone αc = 60° pointing downward at φA2 = −80°. Models with φA2 = < −50° tend to produce east projecting dust, and very broad cones tend to overfill the envelope at some points in order to fill it at others.
Current usage metrics show cumulative count of Article Views (full-text article views including HTML views, PDF and ePub downloads, according to the available data) and Abstracts Views on Vision4Press platform.
Data correspond to usage on the plateform after 2015. The current usage metrics is available 48-96 hours after online publication and is updated daily on week days.
Initial download of the metrics may take a while.