Fig. 14
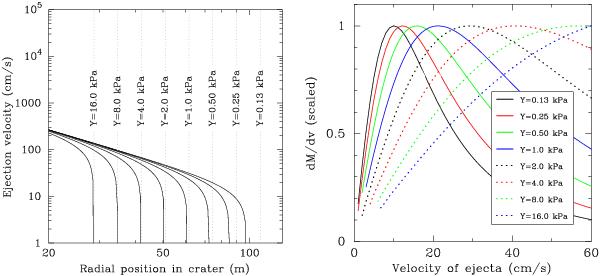
Left: the ejection velocity (not corrected for ve) as a function of the radial position in the crater, with a terminus at the strength-limited crater radius (dotted lines at each strength Y). Each solid curve corresponds to one value of Y. We used an 85 m target radius, an 3000 kg m-3 target density, and a 0.7 m impactor moving at 3 km s-1, close to the nominal values from Paper I. Note that for small Y crater growth stops before the corresponding dotted strength limit as gravity becomes relatively important at low strengths. Right: the differential distribution of ejected mass as a function of ejection velocity (corrected for ve) for various target material strengths Y. Only the lower target strengths correspond to the low debris velocities observed.

Current usage metrics show cumulative count of Article Views (full-text article views including HTML views, PDF and ePub downloads, according to the available data) and Abstracts Views on Vision4Press platform.
Data correspond to usage on the plateform after 2015. The current usage metrics is available 48-96 hours after online publication and is updated daily on week days.
Initial download of the metrics may take a while.