Fig. 12
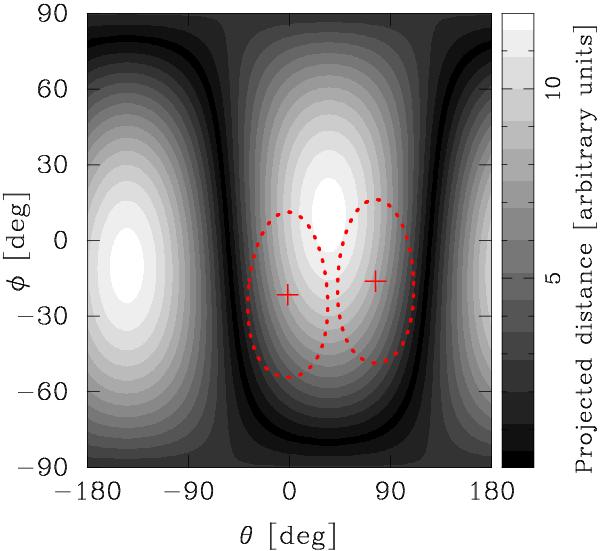
A depiction of the foreshortening of debris orbits emitted on 2009 Feb. 10 and ending at 2010 Jan. 29, with the emission occurring in the direction φA2,θA2 and a velocity vd = 31 cm s-1. Dark regions indicate directions in which particles emitted at slightly different velocities remain close on the sky, and light regions are where such particles appear more separated. Strings of debris emitted in directions where the figure is dark will be less dispersed and more visible. The red + symbols and the dotted curve around it are the nearly degenerate best fit dust cone solutions from the first part of the modeling. The right side (θA2 ≈ 110°) of the the right cone or the left side of the left cone should have enhanced visibility, and, indeed, these regions correspond to the two solutions for Arc 1 and 2 in Fig. 11. In particular, the orbits that could account for Arc 2 exist exclusively in the darkest regions of this figure.
Current usage metrics show cumulative count of Article Views (full-text article views including HTML views, PDF and ePub downloads, according to the available data) and Abstracts Views on Vision4Press platform.
Data correspond to usage on the plateform after 2015. The current usage metrics is available 48-96 hours after online publication and is updated daily on week days.
Initial download of the metrics may take a while.