Fig. 11
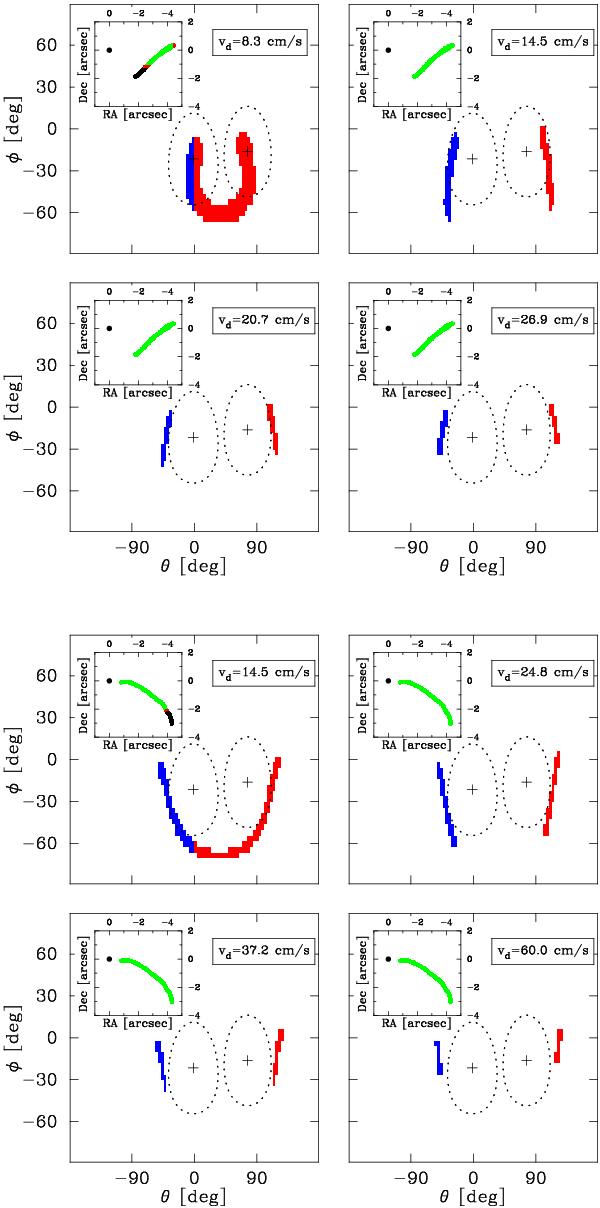
A depiction of which large particle (β = 0) initial debris orbits emitted on 2009 Feb. 10 and ending on 2010 Jan. 29 could have accounted for the Arc 1 (top panel) and Arc 2 (bottom panel) features (see Fig. 2). The separate four-panel plots show the two components of the cross individually, depicted on the RA, Dec plane within the inset. Within each plot, each of the four panels represents one initial particle velocity, and the axes φA2,θA2 are the emission direction of the debris. Colored regions in the φA2,θA2 plane are debris orbits that fall onto the observed feature; they are coded blue and red to denote the two separate islands of solutions on the φA2,θA2 plane. In the RA, Dec inset showing the feature on the sky, regions of the feature are colored red and blue if they are explained by the corresponding orbits in the larger φA2,θA2 plot, green if both the red and green solutions can explain them, and black if no particle orbits can explain this part of the feature. The + symbols and the dotted curves around it are the two solutions best fit dust cones from the first part of the modeling (Figs. 6 and 8). As discussed in the text, there is considerably overlap between the edges of the best fit dust cone and the discrete features in the insets. There is also a correspondence of the features with the regions of maximum foreshortening shown in Fig. 12.
Current usage metrics show cumulative count of Article Views (full-text article views including HTML views, PDF and ePub downloads, according to the available data) and Abstracts Views on Vision4Press platform.
Data correspond to usage on the plateform after 2015. The current usage metrics is available 48-96 hours after online publication and is updated daily on week days.
Initial download of the metrics may take a while.