Fig. 10
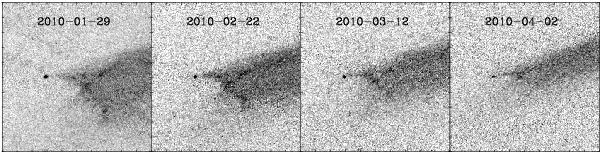
HST images of P/2010 A2, north up and east left, showing the evolution of the central debris feature with time. Each image is 10″ × 10″, and each tick mark is 1″. Most notable is the cross composed of a streak extending southwest from the nucleus, intersected by another streak extending to the northeast, denoted as Arcs 1 and 2 in Fig. 2.
Current usage metrics show cumulative count of Article Views (full-text article views including HTML views, PDF and ePub downloads, according to the available data) and Abstracts Views on Vision4Press platform.
Data correspond to usage on the plateform after 2015. The current usage metrics is available 48-96 hours after online publication and is updated daily on week days.
Initial download of the metrics may take a while.