Fig. 2
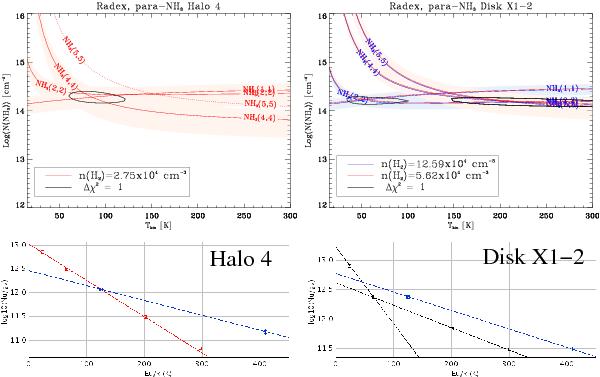
Example of rotational (bottom) and LVG (top) diagrams of NH3. Left: Halo 4. Right: Disk X1-2. In the Boltzmann diagram (bottom), para-NH3 species are fitted with the red line, and the ortho-NH3 species are fitted with the blue line. In the LVG diagrams (top), we plot the peak intensity of the metastable inversion transitions of para-NH3. For the source Halo 4, we derive only one kinetic temperature component (warm), which is plotted in red lines, and the error in red shaded region. The source Disk X1-2 was modeled using a two-kinetic-temperature component model, one warm and one cold, which were plotted in red and blue lines, respectively, with the correspondly associated error shown as shaded regions. We show the n(H2) used in the LVG model for the warm and cold components. To estimate the uncertainty of the derived parameters, we computed the χ2 of the line intensities over the grid used for the LVG model. We impose 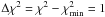 , which translates in the 68.3% (1σ) confidence level projected for each parameter axis (see text for details).
Current usage metrics show cumulative count of Article Views (full-text article views including HTML views, PDF and ePub downloads, according to the available data) and Abstracts Views on Vision4Press platform.
Data correspond to usage on the plateform after 2015. The current usage metrics is available 48-96 hours after online publication and is updated daily on week days.
Initial download of the metrics may take a while.