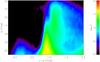
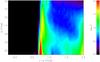
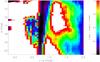
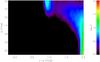
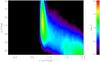
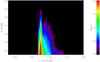
Fig. 14

Hess diagrams of the SDSS data and the Besançon model in (u − g,g). The upper three plots show the Hess diagram of the SDSS data, the model, and the relative difference between the data and model (from left to right). The lower panels show the Hess diagrams of the three simulated components of the Besançon model: thin disc, thick disc, and stellar halo (from left to right). All Hess diagrams cover a range of stellar densities from 1 to 100 per square degree per magnitude in luminosity and 0.1 magnitude in colour (purple to red in the electronic version; black means yet lower number densities). The difference plot (top right) covers a range of relative differences from −100% to + 100% (purple to red in the electronic version; black and white mean larger negative or positive differences, respectively). The ranges in apparent magnitude and colour of these six plots are listed in Cols. 2 and 3 of Table 5). (A colour version is available on-line.)
Current usage metrics show cumulative count of Article Views (full-text article views including HTML views, PDF and ePub downloads, according to the available data) and Abstracts Views on Vision4Press platform.
Data correspond to usage on the plateform after 2015. The current usage metrics is available 48-96 hours after online publication and is updated daily on week days.
Initial download of the metrics may take a while.