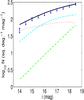
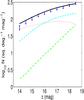
Fig. 13
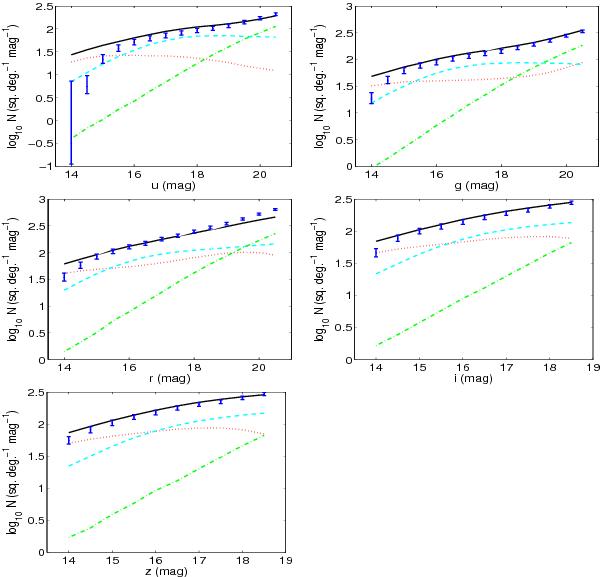
The distributions of apparent magnitude of the Besançon model in the u, g, r, i, and z bands around the NGP. The thin disc, thick disc, and halo are plotted as dotted lines (red), dashed lines (cyan), and dot-dashed lines (green), respectively. The solid lines (black) represent their sums. The error bars (blue) show data from SDSS DR7 for comparison. The samples of the u and z band data are selected in colour intervals of −0.2 ≤ (u − g) < 2.0 and −0.2 ≤ (i − z) < 0.5, respectively. The other colour ranges extend from −0.2 to 1.2 (see second column in Table 5). (A colour version is available on-line.)
Current usage metrics show cumulative count of Article Views (full-text article views including HTML views, PDF and ePub downloads, according to the available data) and Abstracts Views on Vision4Press platform.
Data correspond to usage on the plateform after 2015. The current usage metrics is available 48-96 hours after online publication and is updated daily on week days.
Initial download of the metrics may take a while.