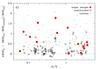
Fig. 13
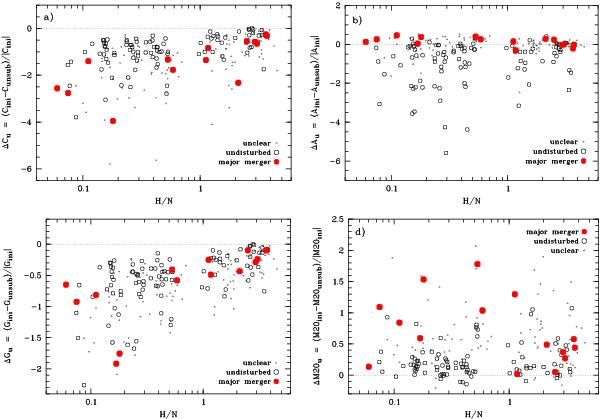
Illustration of the impact of an unsubtracted nucleus on the quantitative morphologies of the simulated AGN galaxies in concentration index C (upper left), asymmetry A (upper right), Gini coefficient G (bottom left), and M20 (bottom right). As a function of H/N, both plots show the initial value before (index ini) and after the addition of a synthetic nucleus (index unsub), normalized to the initial value. See text for a discussion.
Current usage metrics show cumulative count of Article Views (full-text article views including HTML views, PDF and ePub downloads, according to the available data) and Abstracts Views on Vision4Press platform.
Data correspond to usage on the plateform after 2015. The current usage metrics is available 48-96 hours after online publication and is updated daily on week days.
Initial download of the metrics may take a while.