Fig. 10
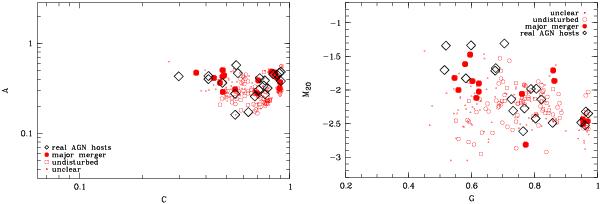
Distribution of the simulated AGN (i.e. a quiescent galaxy with an additional synthetic nucleus (before subtraction), depicted here as circles) and real AGN host galaxies (open diamonds), in concentration index C versus asymmetry A (left) and in Gini coefficient G versus M20 (right). Tiny open symbols depict ambiguous cases, large open symbols show undisturbed galaxies, large filled symbols are classified as major mergers. With respect to the original galaxy images (the distributions of which are shown in Fig. 9), the distinguishability between different morphological types is degraded.
Current usage metrics show cumulative count of Article Views (full-text article views including HTML views, PDF and ePub downloads, according to the available data) and Abstracts Views on Vision4Press platform.
Data correspond to usage on the plateform after 2015. The current usage metrics is available 48-96 hours after online publication and is updated daily on week days.
Initial download of the metrics may take a while.