Fig. 8
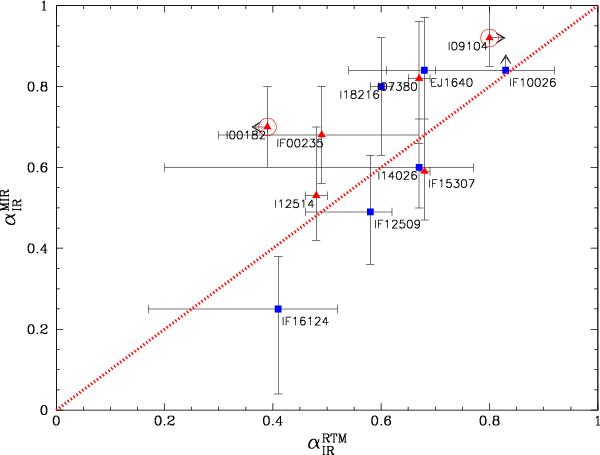
Comparison of the AGN contribution to the IR luminosity estimated through MIR spectral decomposition and through RTM. The blue squares are type I AGN and the red triangles are type II AGN and SB. The open circles mark those sources where our model is inaccurate. MIR contribution for IRAS 00182-7112 from Spoon et al. (2004a).
Current usage metrics show cumulative count of Article Views (full-text article views including HTML views, PDF and ePub downloads, according to the available data) and Abstracts Views on Vision4Press platform.
Data correspond to usage on the plateform after 2015. The current usage metrics is available 48-96 hours after online publication and is updated daily on week days.
Initial download of the metrics may take a while.