Free Access
Fig. 3
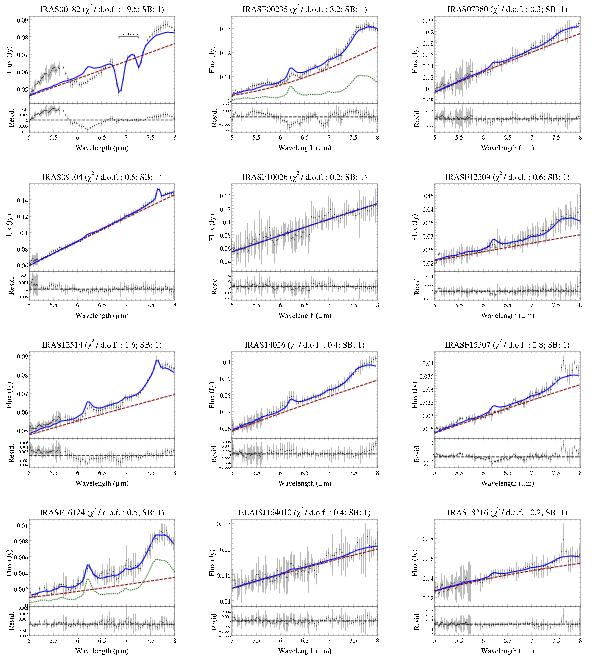
5−8 μm spectra and best-fit models (blue solid line). The AGN component is plotted as a red dashed line. For clarity, the SB component (green dotted line) is plotted only on those sources where the AGN and SB contributions are comparable.
Current usage metrics show cumulative count of Article Views (full-text article views including HTML views, PDF and ePub downloads, according to the available data) and Abstracts Views on Vision4Press platform.
Data correspond to usage on the plateform after 2015. The current usage metrics is available 48-96 hours after online publication and is updated daily on week days.
Initial download of the metrics may take a while.