Free Access
Fig. 1
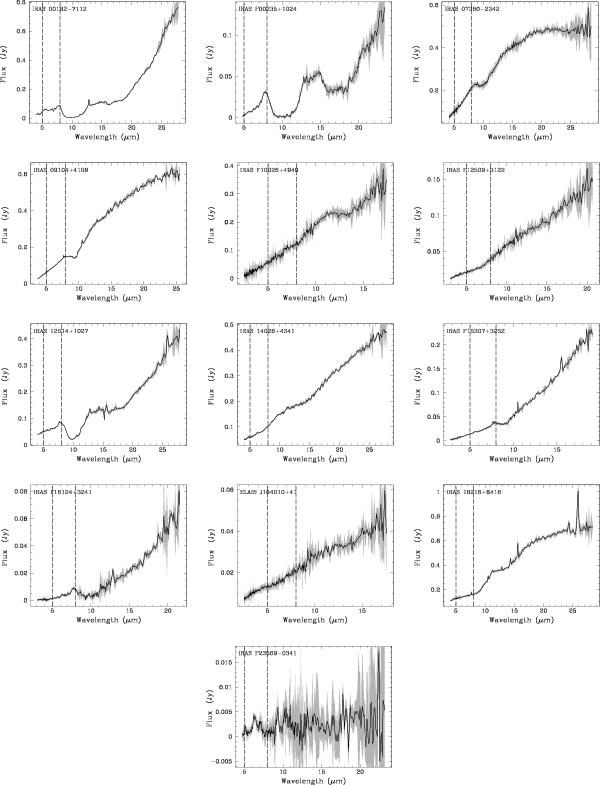
MIR rest-frame spectra of HLIRG obtained with the Infrared Spectrograph on board Spitzer. The grey shaded area is the 1σ uncertainty region. The vertical dashed lines limit the spectral region where our decomposition technique was applied.
Current usage metrics show cumulative count of Article Views (full-text article views including HTML views, PDF and ePub downloads, according to the available data) and Abstracts Views on Vision4Press platform.
Data correspond to usage on the plateform after 2015. The current usage metrics is available 48-96 hours after online publication and is updated daily on week days.
Initial download of the metrics may take a while.