Free Access
Fig. 7
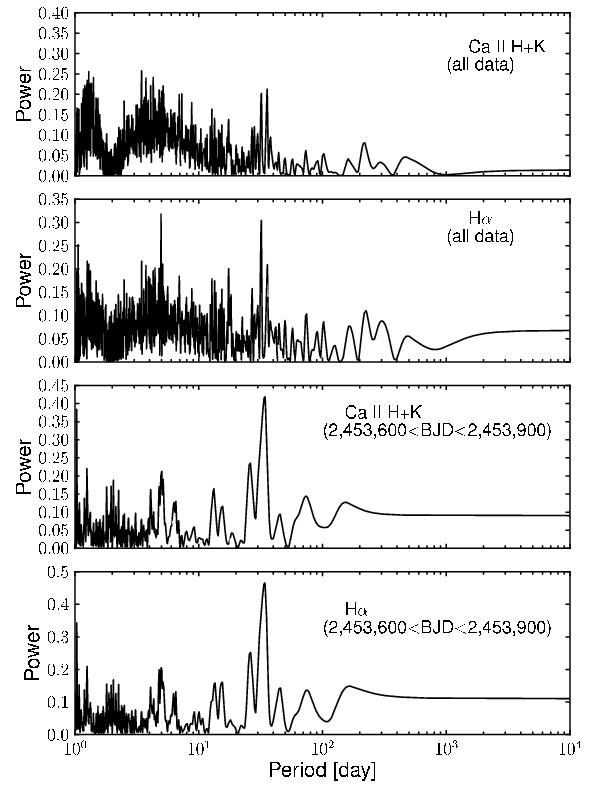
For Gl 205, the top two panels show the periodograms for Ca II H+K and Hα indices, including all data. The bottom two panels show the periodograms for Ca II H+K and Hα indices, restricting the dataset to one observational season (2 453 600 < BJD < 2 543 900).
Current usage metrics show cumulative count of Article Views (full-text article views including HTML views, PDF and ePub downloads, according to the available data) and Abstracts Views on Vision4Press platform.
Data correspond to usage on the plateform after 2015. The current usage metrics is available 48-96 hours after online publication and is updated daily on week days.
Initial download of the metrics may take a while.