Fig. 3
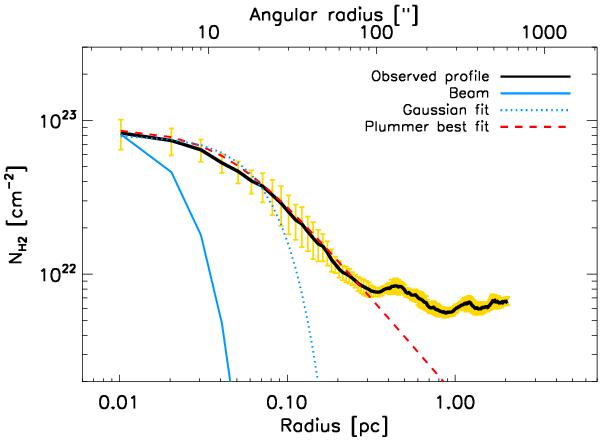
The mean radial density profile (western component) perpendicular to the Vela C ridge (black line in Fig. 2, left), shown here in log-log format. The complementary eastern profile (in the direction of the star cluster) is given in Fig. 4. The area in yellow shows the dispersion of the radial profile along the filament. The solid blue line corresponds to the effective 11.5′′ HPBW resolution of the column density map (0.04 pc at 700 pc) used to construct the profile. The dotted blue line indicates the Gaussian profile, while the dotted red line shows the best fit to the model, often called the Plummer profile.
Current usage metrics show cumulative count of Article Views (full-text article views including HTML views, PDF and ePub downloads, according to the available data) and Abstracts Views on Vision4Press platform.
Data correspond to usage on the plateform after 2015. The current usage metrics is available 48-96 hours after online publication and is updated daily on week days.
Initial download of the metrics may take a while.