Fig. 2
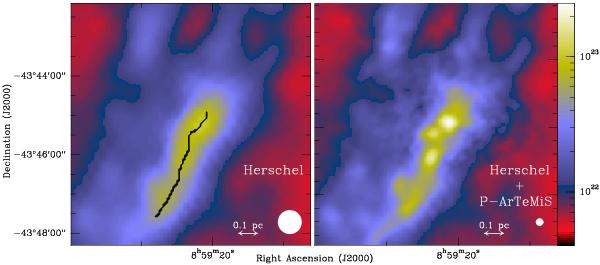
The Vela C ridge/RCW 36 column density maps. The units are in H2 cm-2. Left: map derived from the longest four Herschel wavebands with a resolution of 36′′, equivalent to that of the SPIRE 500 μm band. Right: map constructed using P-ArTéMiS and Herschel data, with resolution 11.5′′. Appendix A details how this map was created. The filament from which the radial density profile (Fig. 3) was determined (see Sect. 3.2) is as indicated by the black line, measured on the right map but, overlaid on the left figure for clarity.
Current usage metrics show cumulative count of Article Views (full-text article views including HTML views, PDF and ePub downloads, according to the available data) and Abstracts Views on Vision4Press platform.
Data correspond to usage on the plateform after 2015. The current usage metrics is available 48-96 hours after online publication and is updated daily on week days.
Initial download of the metrics may take a while.