Fig. 14
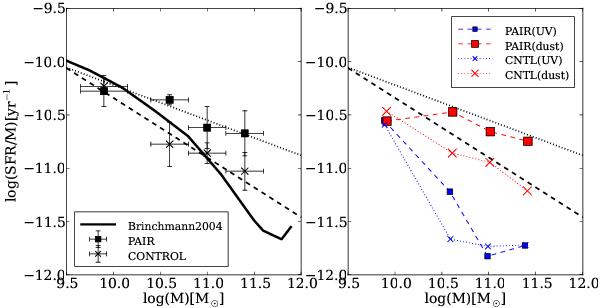
Left: dependence of SSFRs on galaxy stellar mass for paired galaxies (squares) and for the control sample (crosses). The solid line is the result given by Brinchmann et al. (2004), modified for initial mass function (IMF) and H0. Right: similar to left, but divided into UV (small symbols) and dust (large symbols) parts. The dotted line shows the linear regression of the SSFRs-mass relation for spirals in paired galaxies, and the dashed line for control galaxies.
Current usage metrics show cumulative count of Article Views (full-text article views including HTML views, PDF and ePub downloads, according to the available data) and Abstracts Views on Vision4Press platform.
Data correspond to usage on the plateform after 2015. The current usage metrics is available 48-96 hours after online publication and is updated daily on week days.
Initial download of the metrics may take a while.