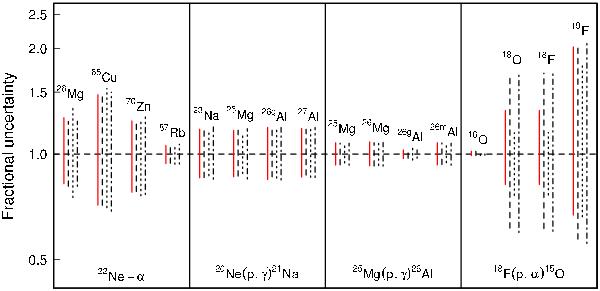
Fig. 3

(Colour online) The yield uncertainties computed from 3 of the parametrisation schemes investigated here compared to the individually sampled reaction rates. The final abundances for four nuclei are considered for each reaction under investigation here. Each group of vertical bars for each nucleus represents, from left to right, the abundances calculated using: (i) the “optimum” reaction rate samples; (ii) the full parametrisation; (iii) the unphysical, random, case; and (iv) constant values of p(T) = a.
Current usage metrics show cumulative count of Article Views (full-text article views including HTML views, PDF and ePub downloads, according to the available data) and Abstracts Views on Vision4Press platform.
Data correspond to usage on the plateform after 2015. The current usage metrics is available 48-96 hours after online publication and is updated daily on week days.
Initial download of the metrics may take a while.


