Fig. 9
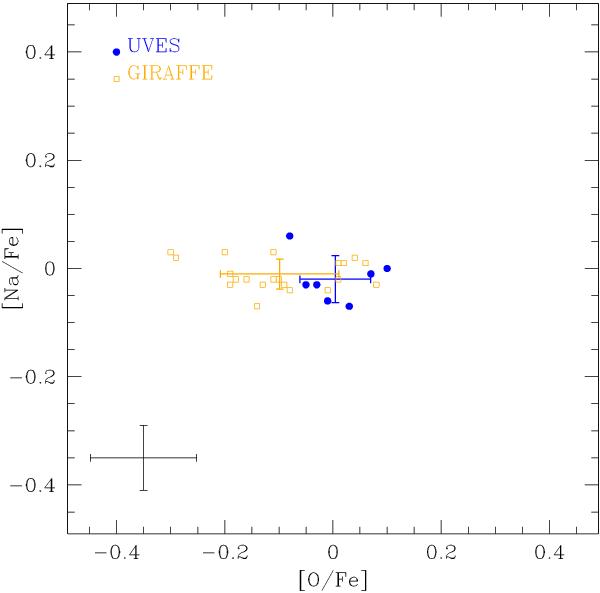
Na and O distribution for the UVES (filled blue points) and the bright GIRAFFE (open orange squares). The rms in O and Na are shown by errorbars of different colour. The expected errors on O and Na abundances (see Table 4) are shown as black errorbars in the left lower corner of the plot; they are comparable to the observed rms.
Current usage metrics show cumulative count of Article Views (full-text article views including HTML views, PDF and ePub downloads, according to the available data) and Abstracts Views on Vision4Press platform.
Data correspond to usage on the plateform after 2015. The current usage metrics is available 48-96 hours after online publication and is updated daily on week days.
Initial download of the metrics may take a while.