Free Access
Fig. 2
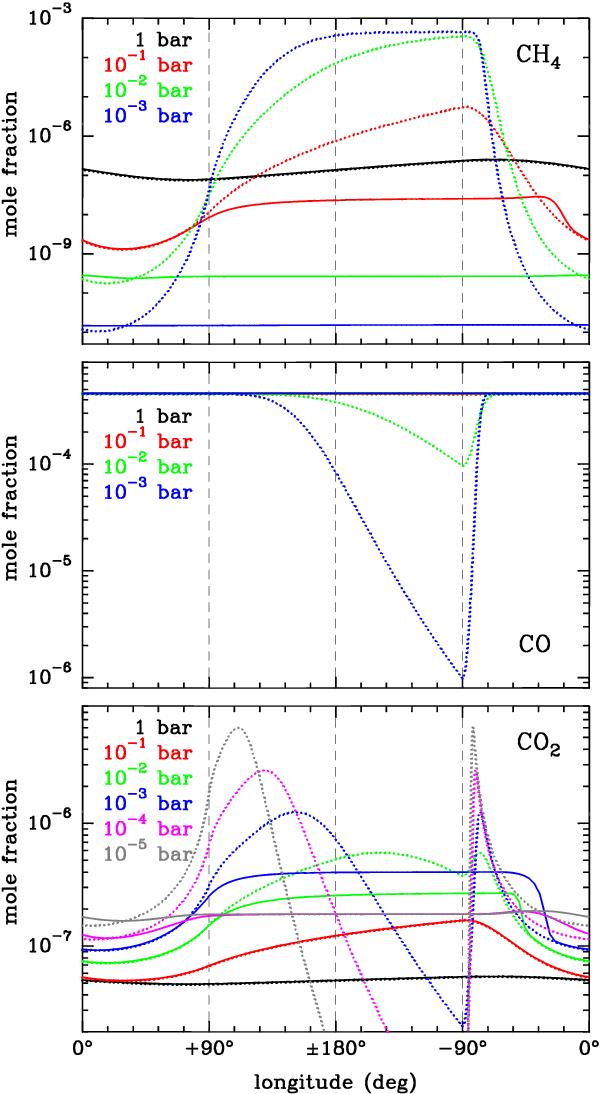
Longitudinal distributions of the mole fractions of CH4, CO, and CO2 for selected pressure levels, as calculated by the chemical kinetics model with a uniform zonal wind of 1 km s-1 (solid lines) and by chemical equilibrium adopting the longitudinal temperature profile of each pressure level (dotted lines).
Current usage metrics show cumulative count of Article Views (full-text article views including HTML views, PDF and ePub downloads, according to the available data) and Abstracts Views on Vision4Press platform.
Data correspond to usage on the plateform after 2015. The current usage metrics is available 48-96 hours after online publication and is updated daily on week days.
Initial download of the metrics may take a while.