Fig. 1
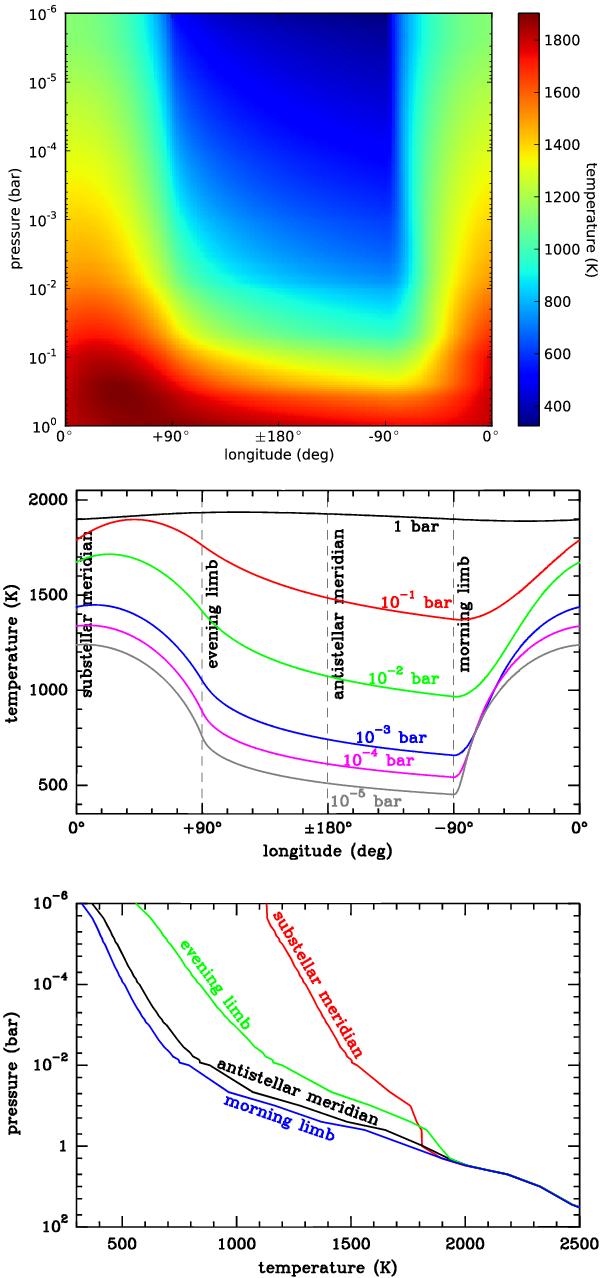
Thermal atmospheric structure of HD 209458b. The top panel shows the temperature distribution as a function of longitude and pressure, while the middle panel shows the temperature as a function of longitude at selected pressure levels. The bottom panel shows the vertical temperature profiles at the substellar and antistellar meridians and at the morning and evening limbs.
Current usage metrics show cumulative count of Article Views (full-text article views including HTML views, PDF and ePub downloads, according to the available data) and Abstracts Views on Vision4Press platform.
Data correspond to usage on the plateform after 2015. The current usage metrics is available 48-96 hours after online publication and is updated daily on week days.
Initial download of the metrics may take a while.