Free Access
Fig. 4
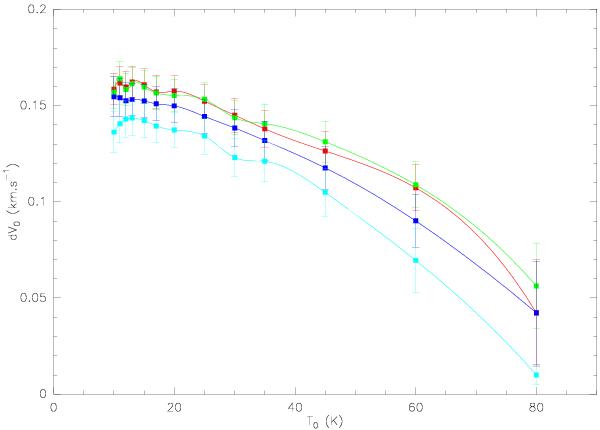
Derived nonthermal linewidth dV0 at Rv = 300 AU as a function of assumed kinetic temperature profile. T0 is the temperature at Rt = 300 AU. The 4 curves correspond to different exponents q = 0 (red), 0.2 (green), 0.4 (blue), and 0.6 (cyan). Errorbars are ± 1σ.
Current usage metrics show cumulative count of Article Views (full-text article views including HTML views, PDF and ePub downloads, according to the available data) and Abstracts Views on Vision4Press platform.
Data correspond to usage on the plateform after 2015. The current usage metrics is available 48-96 hours after online publication and is updated daily on week days.
Initial download of the metrics may take a while.