Fig. 6
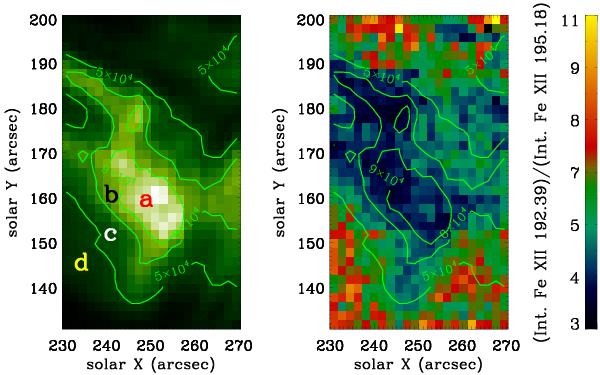
Left panel: intensity map of Fe xii 192 Å. Right panel: the intensity ratio of Fe xii 192 Å and Fe xii 195.2 Å lines. Smaller ratios correspond to higher electron densities. The identified moss area (regions a and b) lie in the regions with higher density, as expected. Contours of intensity of the Fe xii 192 Å line are plotted on both maps.
Current usage metrics show cumulative count of Article Views (full-text article views including HTML views, PDF and ePub downloads, according to the available data) and Abstracts Views on Vision4Press platform.
Data correspond to usage on the plateform after 2015. The current usage metrics is available 48-96 hours after online publication and is updated daily on week days.
Initial download of the metrics may take a while.