Fig. 5
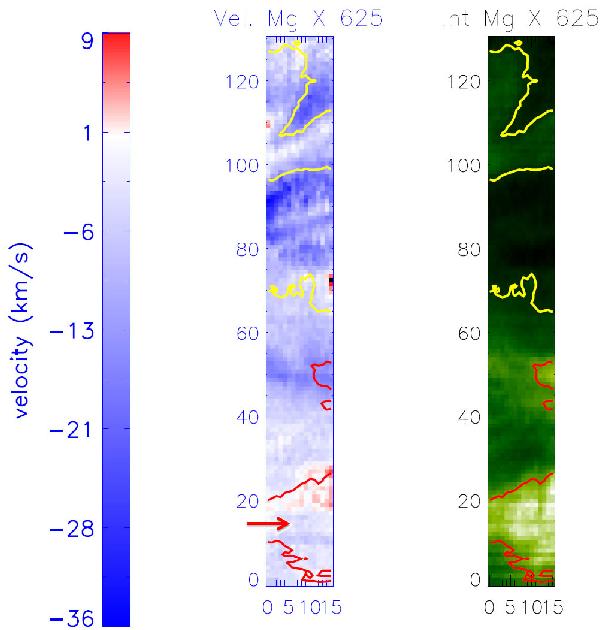
Intensity and velocity maps of Mg x 625 Å obtained by the sit-and-stared SUMER observations. Contours of Fe x 184 Å are plotted on both maps. The area that is marked by the red arrow corresponds to region b in the moss area (defined in the left panel of Fig. 6). The average Doppler velocity of Mg x 625 Å is of −6.6 km s-1 inside region b and of (− 5.50 ± 0.55) km s-1 over the whole area shown here.
Current usage metrics show cumulative count of Article Views (full-text article views including HTML views, PDF and ePub downloads, according to the available data) and Abstracts Views on Vision4Press platform.
Data correspond to usage on the plateform after 2015. The current usage metrics is available 48-96 hours after online publication and is updated daily on week days.
Initial download of the metrics may take a while.