Fig. 4
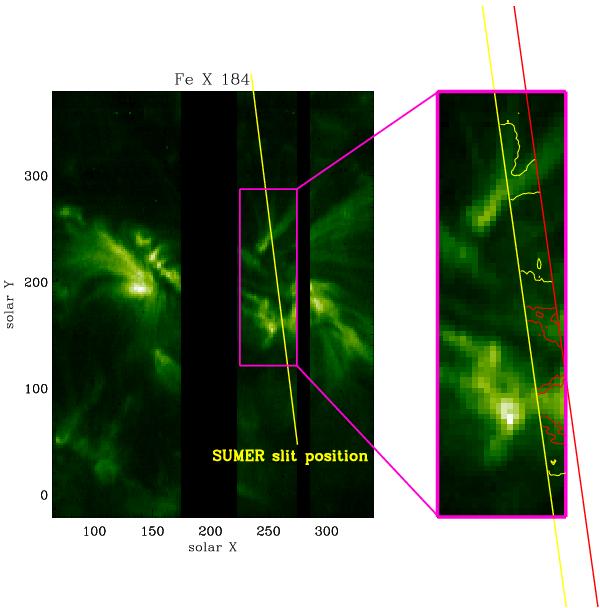
Left panel: the position of the SUMER slit at the start of the drift scan over-plotted on the EIS Fe x 184 Å intensity image raster. The SUMER slit crosses the moss area that we have studied in this paper. Right panel: blow up of the pink box in the left panel. Intensity contours of Mg x 625 Å are plotted on top of the intensity map of the Fe x 184 Å line.
Current usage metrics show cumulative count of Article Views (full-text article views including HTML views, PDF and ePub downloads, according to the available data) and Abstracts Views on Vision4Press platform.
Data correspond to usage on the plateform after 2015. The current usage metrics is available 48-96 hours after online publication and is updated daily on week days.
Initial download of the metrics may take a while.