Free Access
Fig. 3
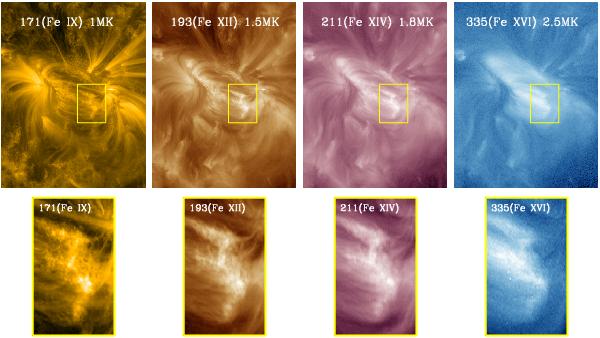
The NOAA active region 11243 is shown in different wavelength bands of AIA/SDO (top panels). The images are taken on 4th July 2011 at 17:00 UTC. The yellow boxes show the moss area studied in this work. Lower panels are blow ups of the corresponding yellow boxes.
Current usage metrics show cumulative count of Article Views (full-text article views including HTML views, PDF and ePub downloads, according to the available data) and Abstracts Views on Vision4Press platform.
Data correspond to usage on the plateform after 2015. The current usage metrics is available 48-96 hours after online publication and is updated daily on week days.
Initial download of the metrics may take a while.