Free Access
Fig. 12
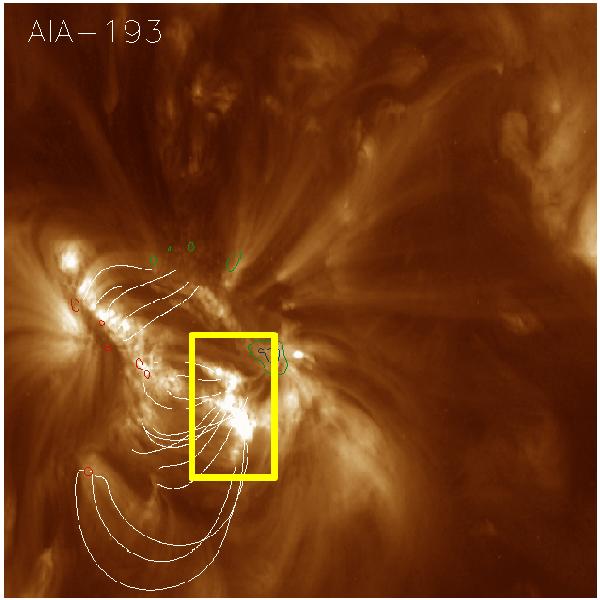
Magnetic field lines extrapolated from photospheric field and plotted over Fe xii 193 Å image of AIA/SDO. Red contours show positive and blue and green contours show negative polarities. The yellow frame represents the region of the moss study in this work.
Current usage metrics show cumulative count of Article Views (full-text article views including HTML views, PDF and ePub downloads, according to the available data) and Abstracts Views on Vision4Press platform.
Data correspond to usage on the plateform after 2015. The current usage metrics is available 48-96 hours after online publication and is updated daily on week days.
Initial download of the metrics may take a while.