Fig. 11
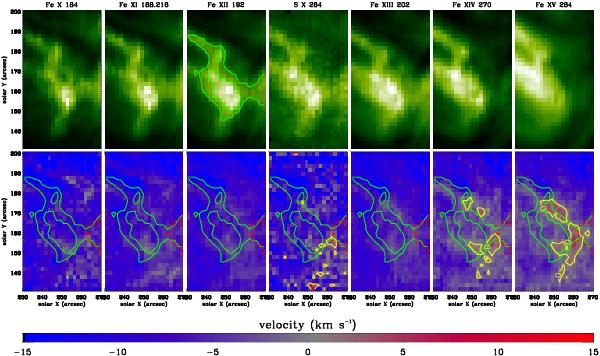
Intensity (upper panels) and velocity maps (lower panels) for Different ions with different formation temperatures. Green contours are intensity contours of Fe xii 192 Å plotted on top of intensity (top row) and velocity maps (bottom row) of different ions. Yellow contours on velocity maps outline red shifted pixels. Red contour is the brightest area which is common in both EIS and SUMER field of views and is used for velocity calibration.
Current usage metrics show cumulative count of Article Views (full-text article views including HTML views, PDF and ePub downloads, according to the available data) and Abstracts Views on Vision4Press platform.
Data correspond to usage on the plateform after 2015. The current usage metrics is available 48-96 hours after online publication and is updated daily on week days.
Initial download of the metrics may take a while.