Fig. 7
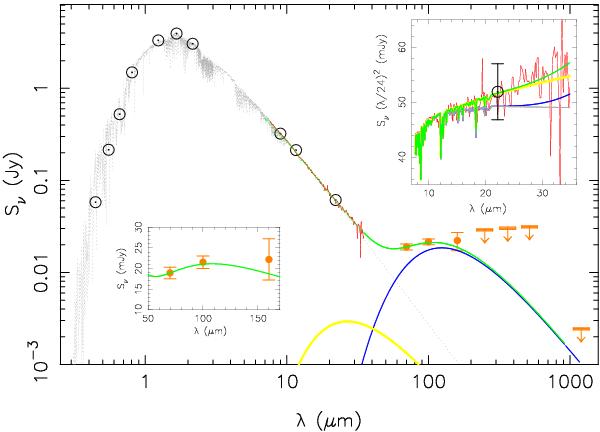
SED of the best fits of the cold disk and warm belt models. The green curve corresponds to the warm and cold dust emissions added to the Next Gen stellar atmosphere spectrum (gray). IRS spectrum is in red. We also show separately the best fit of the warm belt emission (rw = 0.2 AU and mw = 2.8 × 10⁻⁶ M$) (yellow) and the best fit of the cold disk emission (parameters of the combined fit are in Table 3) (blue). Insets and photometric data points are the same as in the legend of Fig. 6.
Current usage metrics show cumulative count of Article Views (full-text article views including HTML views, PDF and ePub downloads, according to the available data) and Abstracts Views on Vision4Press platform.
Data correspond to usage on the plateform after 2015. The current usage metrics is available 48-96 hours after online publication and is updated daily on week days.
Initial download of the metrics may take a while.