Fig. 9
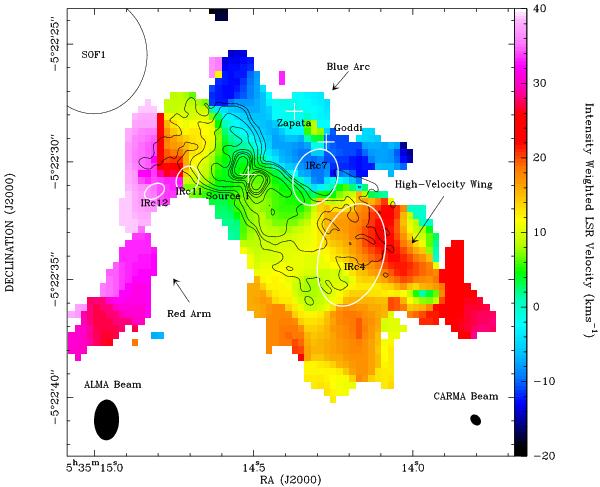
Intensity-weighted velocity (moment 1) map of the v = 0 J = 5–4 28SiO line emission with overlaid contours from the v = 0 J = 2–1 28SiO total intensity (Plambeck et al. 2009). Only pixels with fluxes > 1 Jy beam-1 or 4 times the rms noise of the channel with the brightest emission, were used. The white ellipses indicate the positions (Shuping et al. 2004) and approximate sizes (estimated from Shuping et al. 2004) of the infrared sources IRc4, IRc7, IRc11 and IRc12. Source I is marked with a white cross. The newly discovered infrared source SOF1 (de Buizer et al. 2012) is indicated as a circle in the upper left corner. The two white crosses in the blue arc labeled “Goddi” and “Zapata” are the points of interaction between Source I and BN as derived by Goddi et al. (2011a) and Zapata et al. (2009), respectively.
Current usage metrics show cumulative count of Article Views (full-text article views including HTML views, PDF and ePub downloads, according to the available data) and Abstracts Views on Vision4Press platform.
Data correspond to usage on the plateform after 2015. The current usage metrics is available 48-96 hours after online publication and is updated daily on week days.
Initial download of the metrics may take a while.