Fig. 8
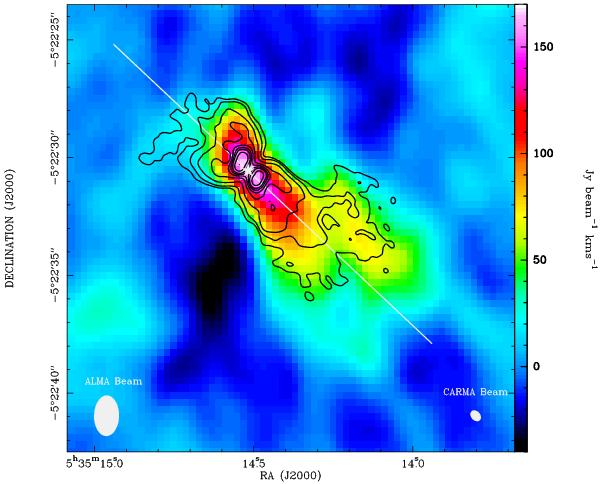
Total intensity (moment 0) map of the v = 0 J = 5–4 28SiO line. Overplotted are contours of the v = 0 J = 2–1 28SiO total intensity from Plambeck et al. (2009) obtained with CARMA. Contours are at 0.1, 0.2, 0.4, 0.7, 1.1, 1.5, 1.9, 2.6 and 3.7 Jy beam-1 km s-1. The white star marks the position of Source I. The axis of the outflow (PA ~ 50°) is indicated by a white line.
Current usage metrics show cumulative count of Article Views (full-text article views including HTML views, PDF and ePub downloads, according to the available data) and Abstracts Views on Vision4Press platform.
Data correspond to usage on the plateform after 2015. The current usage metrics is available 48-96 hours after online publication and is updated daily on week days.
Initial download of the metrics may take a while.