Fig. 7
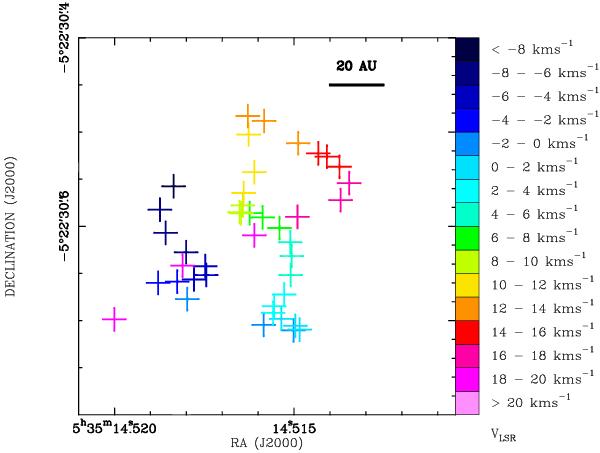
Fitted positions of the 28SiO v = 1 emission. The crosses are color coded by velocity. We see that there is a clear velocity gradient along the northwest-southeast direction, with blue-shifted emission in the eastern part and red-shifted emission in the western part. This is in good agreement with the result obtained by Matthews et al. (2010) from VLBA data for the v = 1 J = 1–0 transition. The size of the image is about 160 AU × 160 AU.
Current usage metrics show cumulative count of Article Views (full-text article views including HTML views, PDF and ePub downloads, according to the available data) and Abstracts Views on Vision4Press platform.
Data correspond to usage on the plateform after 2015. The current usage metrics is available 48-96 hours after online publication and is updated daily on week days.
Initial download of the metrics may take a while.