Fig. 3
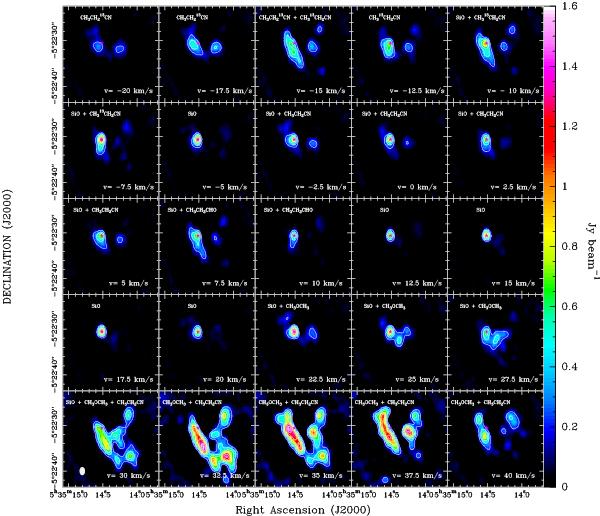
Channel maps of the 28SiO v = 2 J = 5–4 line emission. The contours in each channel are 3, 6, 9, 12, 15, 18, 21 and 24 times the rms noise in the peak line channel (0.065 Jy beam-1). Every channel is 2.5 km s-1 wide and the central LSR velocity is indicated in the lower right corner of each box. In the central channels, the SiO emission is unresolved and peaks at the position of Source I (pink star symbol), probably tracing the inner parts of the outflow associated with Source I (as the 28SiO v = 1 transition). In addition, strong diffuse emission is evident away from the systemic velocity blending the SiO line, that we attribute to CH3CH2CN, CH3CH2CHO and CH3OCH3. The ALMA synthesized beam is indicated as a white ellipse in the lower left panel.
Current usage metrics show cumulative count of Article Views (full-text article views including HTML views, PDF and ePub downloads, according to the available data) and Abstracts Views on Vision4Press platform.
Data correspond to usage on the plateform after 2015. The current usage metrics is available 48-96 hours after online publication and is updated daily on week days.
Initial download of the metrics may take a while.