Fig. 2
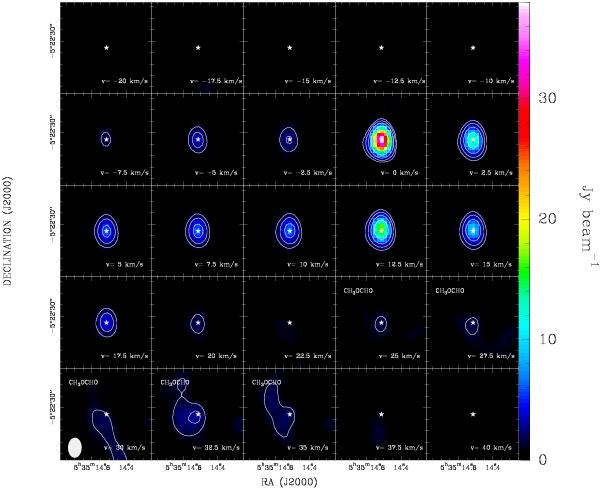
Channel maps of the 28SiO v = 1 J = 5–4 line emission. The white contours are at 4, 8, 16, 32, 64 and 128 times the rms noise in the peak line channel (0.29 Jy beam-1). Every channel is 2.5 km s-1 wide and the central LSR velocity is indicated in the lower right corner of each box. The two narrow emission features in the spectral profile at around 0 km s-1 and 12 km s-1 are clearly evident in the channel maps. The emission from the v = 1 28SiO line in the central channel maps is unresolved and centered at Source I (marked with a white star in each channel). The more diffuse emission at velocities > 25 km s-1 instead does not peak at the position of Source I and is likely associated with CH3OCHO. The ALMA synthesized beam is indicated as a white ellipse in the lower left panel.
Current usage metrics show cumulative count of Article Views (full-text article views including HTML views, PDF and ePub downloads, according to the available data) and Abstracts Views on Vision4Press platform.
Data correspond to usage on the plateform after 2015. The current usage metrics is available 48-96 hours after online publication and is updated daily on week days.
Initial download of the metrics may take a while.