Free Access
Fig. 11
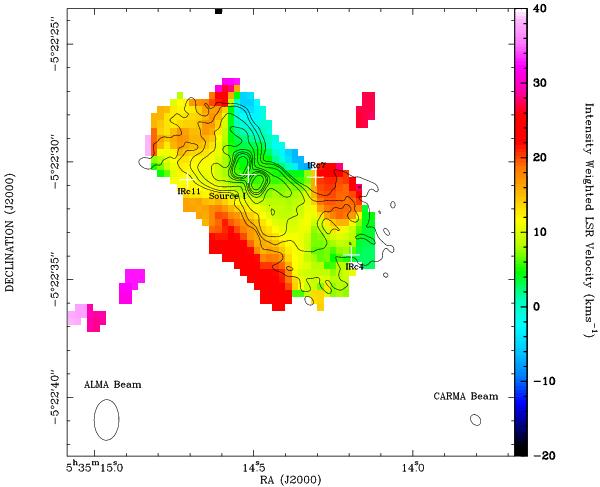
Moment 1 map of the v = 0 J = 5–4 29SiO line with overlaid contours from the v = 0 J = 2–1 28SiO total intensity. Only pixels with fluxes larger than 4 times the rms noise of 0.17 Jy beam-1 were used to produce this map. The crosses mark the positions of IRc11, Source I, IRc7 and IRc4.
Current usage metrics show cumulative count of Article Views (full-text article views including HTML views, PDF and ePub downloads, according to the available data) and Abstracts Views on Vision4Press platform.
Data correspond to usage on the plateform after 2015. The current usage metrics is available 48-96 hours after online publication and is updated daily on week days.
Initial download of the metrics may take a while.