Fig. 3
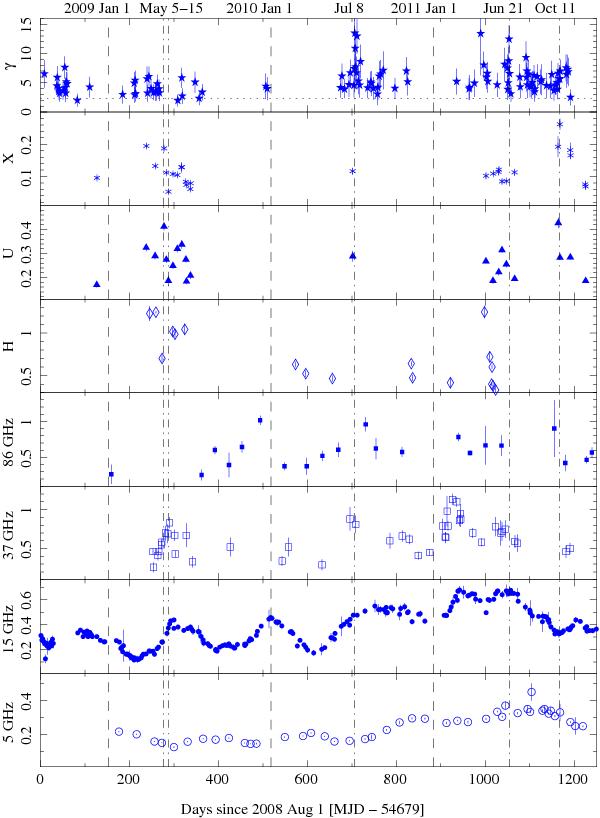
Light curves at various frequencies. From top to bottom: γ-rays 0.1–100 GeV from Fermi/LAT with 1 day time bin [10-7 ph cm-2 s-1]; X-ray 0.3–10 keV from Swift/XRT [c s-1]; U filter (350 nm) from Swift/UVOT [mJy]; H filter (1.65 μm) from INAOE [mJy]; 86 GHz from IRAM [Jy]; 37 GHz from Metsähovi [Jy]; 15 GHz from OVRO, Effelsberg, and MOJAVE [Jy]; 5 GHz from Effelsberg and Medicina. Time starts on 2008 August 1 00:00 UTC (MJD 54 679). Fermi performs an all-sky survey every two orbits (three hours) and thus observed PMN J0948 + 0022 almost continuously. However, for clarity, we do not plot the upper limits. The TS = 4 average sensitivity of LAT for one-day exposure is indicated with the horizontal dotted line in the top panel, which corresponds to ~2.3 × 10⁻⁷ ph cm-2 s-1 (assuming Γ = 2.67). Vertical dashed lines are shown at the beginning of each year (Jan. 1). Vertical dot-dashed lines indicate the days referring to the SED selected as example (see Sect. 4).
Current usage metrics show cumulative count of Article Views (full-text article views including HTML views, PDF and ePub downloads, according to the available data) and Abstracts Views on Vision4Press platform.
Data correspond to usage on the plateform after 2015. The current usage metrics is available 48-96 hours after online publication and is updated daily on week days.
Initial download of the metrics may take a while.