Fig. 9
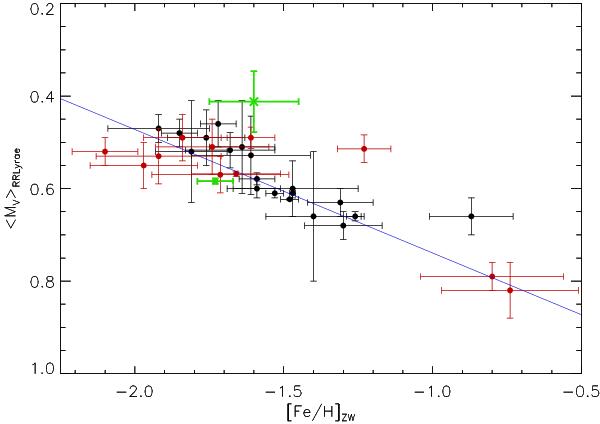
⟨ MV ⟩ vs. [Fe/H] for clusters in the literature for which Fourier decomposition of the RR Lyrae variables was performed. Points obtained by analysing the light curves of RR0 variables are shown as black filled circles, while points from analysis of RR1 variables are marked as red filled circles; the data for NGC 1904 are shown as a green cross (RR0 variables) and a green filled circle (RR1 variables). The best linear fit is shown as a blue line, with coefficients given in the text. All points are plotted with 1-σ error bars.
Current usage metrics show cumulative count of Article Views (full-text article views including HTML views, PDF and ePub downloads, according to the available data) and Abstracts Views on Vision4Press platform.
Data correspond to usage on the plateform after 2015. The current usage metrics is available 48-96 hours after online publication and is updated daily on week days.
Initial download of the metrics may take a while.