Fig. 8
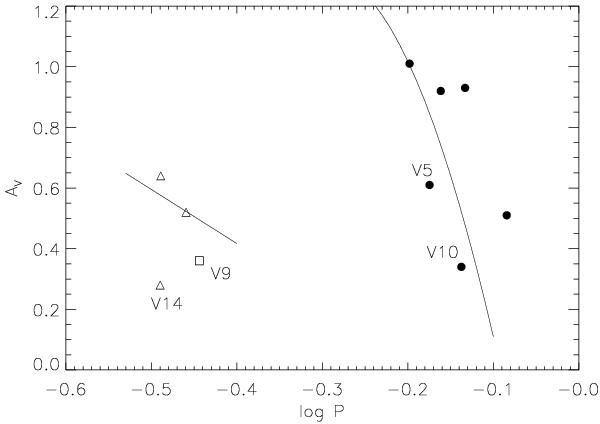
Bailey diagram of the V-band light curve amplitude versus the logarithm of the period for RR Lyrae stars in NGC 1904. RR0 variables are plotted as filled circles, and RR1 variables as open triangles; V9 is plotted as an open square as it is a potential double-mode RR Lyrae star. We also mark the locations of V5 and V10, whose amplitude is underestimated because of blending. Also plotted as solid lines are the relations of Cacciari et al. (2005) for evolved stars; these are obtained by applying a shift of +0.06 to log P in the relations derived for Oosterhoff type I cluster M3.
Current usage metrics show cumulative count of Article Views (full-text article views including HTML views, PDF and ePub downloads, according to the available data) and Abstracts Views on Vision4Press platform.
Data correspond to usage on the plateform after 2015. The current usage metrics is available 48-96 hours after online publication and is updated daily on week days.
Initial download of the metrics may take a while.