Fig. 7
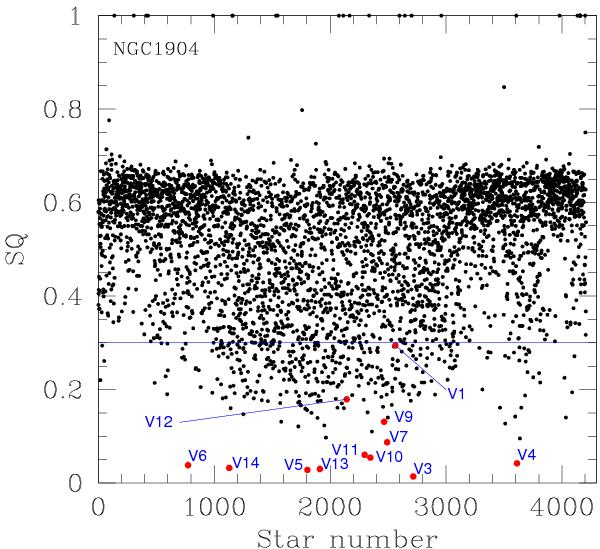
Distribution of the SQ statistic (see text) applied to the V-band light curves of all stars in our sample (black filled circles). A blue horizontal line marks the threshold of SQ = 0.3 below which we inspected the light curves for periodic variability. The locations of the confirmed variables in our sample are marked with red filled circles; V7 is not shown as it does not appear to be periodic, but rather shows long-term variability.
Current usage metrics show cumulative count of Article Views (full-text article views including HTML views, PDF and ePub downloads, according to the available data) and Abstracts Views on Vision4Press platform.
Data correspond to usage on the plateform after 2015. The current usage metrics is available 48-96 hours after online publication and is updated daily on week days.
Initial download of the metrics may take a while.