Fig. 11
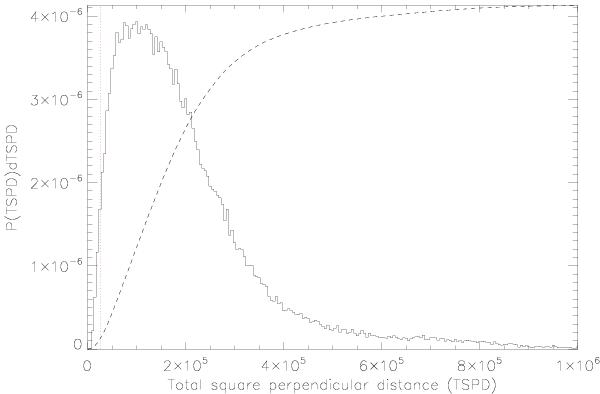
Histogram distribution of the total square perpendicular distance (TSPD) for a linear fit to 105 random samples of 10 HB stars, compared to TSPDvar, the TSPD of the fit to the RR Lyrae stars in NGC 1904 (red vertical dotted line). The cumulative probability distribution is also plotted as a dashed line; the probability that the value of TSPD is equal to or lower than TSPDvar is ~2.8%.
Current usage metrics show cumulative count of Article Views (full-text article views including HTML views, PDF and ePub downloads, according to the available data) and Abstracts Views on Vision4Press platform.
Data correspond to usage on the plateform after 2015. The current usage metrics is available 48-96 hours after online publication and is updated daily on week days.
Initial download of the metrics may take a while.