Fig. 8
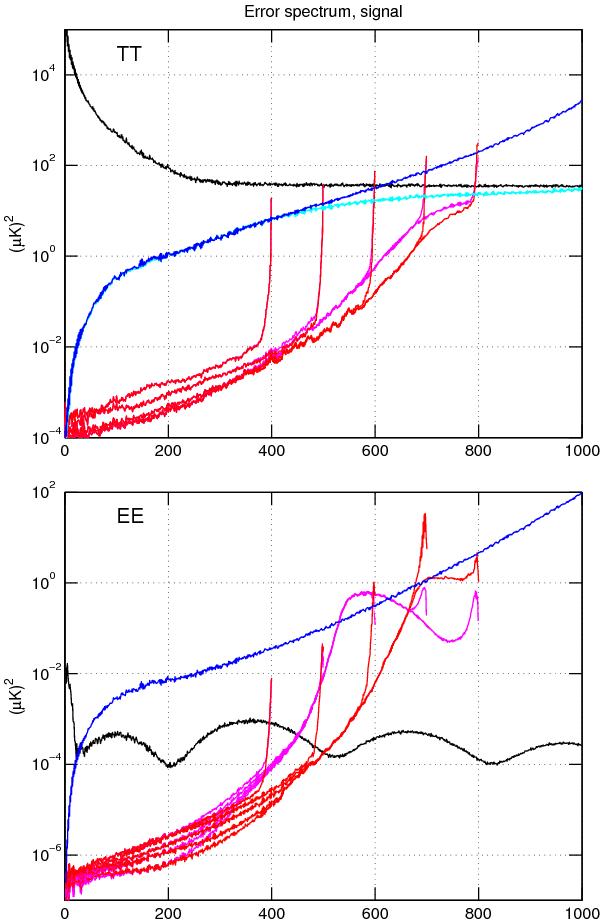
30 GHz error spectrum, for T (top) and E (bottom), without noise. See main text for definition. The deconvolution results are shown for the same combinations of parameters as in Fig. 7. The input spectrum is shown in black. Also shown is the error spectrum for a harmonic expansion of the binned map, corrected with a window function of a symmetric Gaussian beam (blue), or (T only) with an ideal window function (light blue). The ideal window function was defined as the ratio of the input spectrum and the spectrum of the uncorrected binned map.
Current usage metrics show cumulative count of Article Views (full-text article views including HTML views, PDF and ePub downloads, according to the available data) and Abstracts Views on Vision4Press platform.
Data correspond to usage on the plateform after 2015. The current usage metrics is available 48-96 hours after online publication and is updated daily on week days.
Initial download of the metrics may take a while.