Fig. 7
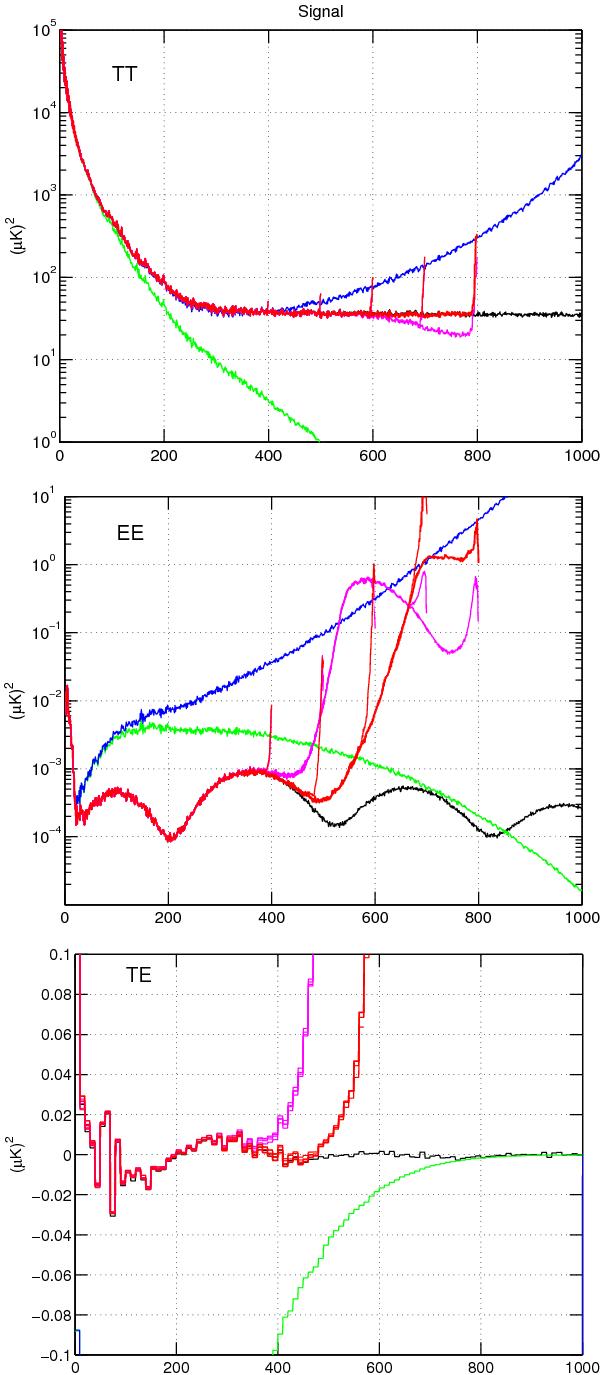
Noise-free 30 GHz TT (top), EE (middle), and TE (bottom) spectra. Shown are the input (black) and the spectra constructed from the aXlm coefficients from deconvolution. Deconvolution results are shown for kmax = 4 (purple) and kmax = 6 (red), and for lmax = 400, 500, 600, 700, 800. The best-case results (lmax = 800, kmax = 6) are plotted with a thicker linetype. For comparison we show also the spectrum obtained from harmonic expansion of a naive binned map (green). The spectrum of the binned map decreases rapidly with l because the binning procedure inherently produces a beam-smoothed map. The blue line (TT and EE) is obtained by dividing the latter by the window function of a symmetric Gaussian beam with FWHM = 32′. The TE spectra have been binned over ten multipoles to reduce scatter and to make the plot more readable.
Current usage metrics show cumulative count of Article Views (full-text article views including HTML views, PDF and ePub downloads, according to the available data) and Abstracts Views on Vision4Press platform.
Data correspond to usage on the plateform after 2015. The current usage metrics is available 48-96 hours after online publication and is updated daily on week days.
Initial download of the metrics may take a while.