Fig. 17
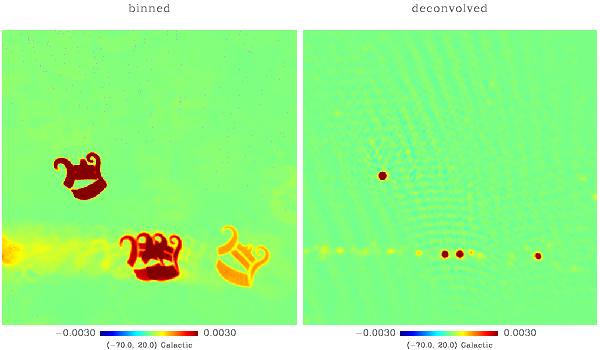
Sky seen through a D-beam: binned (left) and deconvolved (right) temperature map. The beam transforms the image of a point source into an image of the beam. Deconvolution recovers the original shapes of the sources. The size of the shown patch is 83.3° squared. The horizontal structure near the bottom of the plots is the accumulation of weak point sources in the galactic plane.
Current usage metrics show cumulative count of Article Views (full-text article views including HTML views, PDF and ePub downloads, according to the available data) and Abstracts Views on Vision4Press platform.
Data correspond to usage on the plateform after 2015. The current usage metrics is available 48-96 hours after online publication and is updated daily on week days.
Initial download of the metrics may take a while.