Fig. 15
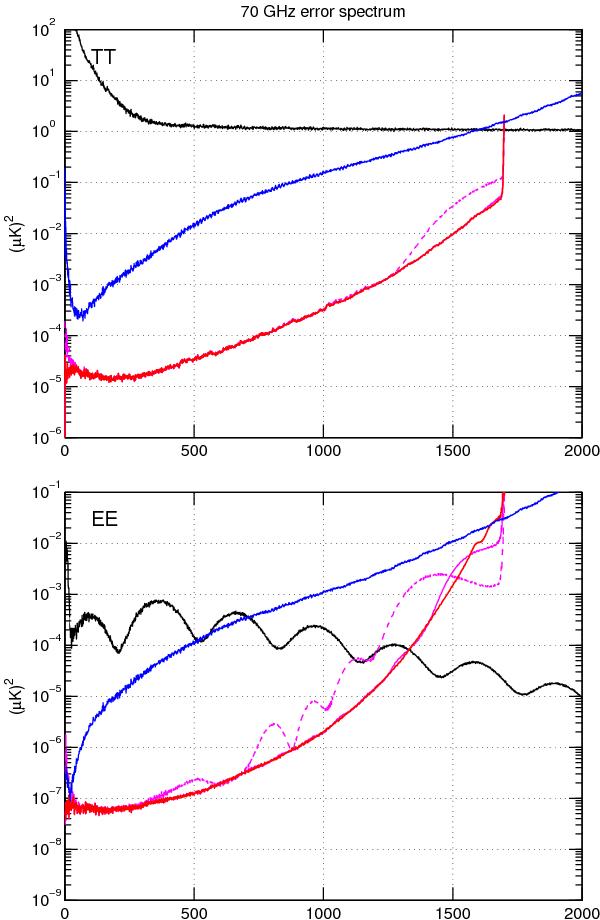
70 GHz TT (top) and EE (bottom) error spectra, without noise. The blue line represents harmonic expansion of the binned map, corrected for a symmetric beam with FWHM = 13′. The fully converged deconvolution result (lmax = 1700, kmax = 6), is shown by a red line. We also show the error after 200 (purple dashed) and 500 (purple solid) iteration steps.
Current usage metrics show cumulative count of Article Views (full-text article views including HTML views, PDF and ePub downloads, according to the available data) and Abstracts Views on Vision4Press platform.
Data correspond to usage on the plateform after 2015. The current usage metrics is available 48-96 hours after online publication and is updated daily on week days.
Initial download of the metrics may take a while.