Free Access
Fig. 13
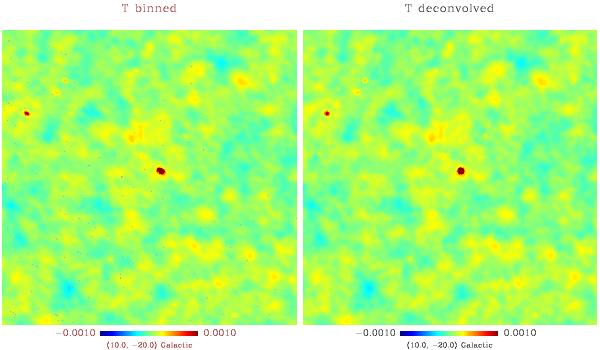
70 GHz temperature map without noise: binned (left) and deconvolved (right). The deconvolved map was smoothed to resolution FWHM = 13′, corresponding to the mean width of the actual beam. Shown is the same patch of sky as in Fig. 4.
This figure is made of several images, please see below:
Current usage metrics show cumulative count of Article Views (full-text article views including HTML views, PDF and ePub downloads, according to the available data) and Abstracts Views on Vision4Press platform.
Data correspond to usage on the plateform after 2015. The current usage metrics is available 48-96 hours after online publication and is updated daily on week days.
Initial download of the metrics may take a while.