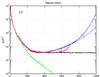
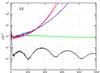
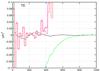
Fig. 11

30 GHz TT, EE, and TE spectra with white noise included. The TE spectra have been binned over 20 multipoles. The deconvolution results are shown for three combinations of parameters: kmax = 4 and lmax = 600, 700 (purple), and kmax = 6, lmax = 6 (red). The spectrum of a naive binned map is shown in green. The blue line shows the spectrum of the binned map corrected for a symmetric beam. The corresponding noise-free result is shown with dashed linetype in the TT plot, to indicate the region where noise begins to dominate over signal.
Current usage metrics show cumulative count of Article Views (full-text article views including HTML views, PDF and ePub downloads, according to the available data) and Abstracts Views on Vision4Press platform.
Data correspond to usage on the plateform after 2015. The current usage metrics is available 48-96 hours after online publication and is updated daily on week days.
Initial download of the metrics may take a while.